Data decisions only work when the data behind them is accurate, connected, and easy to access. Many businesses invest in dashboards and reports but still struggle because their data sits in different tools, doesn’t sync properly, or lacks context. That gap usually comes from picking tools without a clear evaluation process.
The right setup depends on how your business collects data, how teams use it, and how systems communicate with each other. When analytics and integration tools align with these factors, reporting becomes faster, insights become clearer, and operations run with fewer manual steps.
The cost of getting this wrong is high. Gartner estimates that poor data quality costs organizations an average of $12.9 million every year. This is why tool selection should be based on fit, not popularity.
What Are Data Analytics & Integration Tools?
Data Analytics Tools
Data analytics tools convert raw data into useful insights. They help teams understand trends, measure performance, and make decisions backed by real numbers.
Some widely used tools include:
- Tableau for advanced visual dashboards
- Microsoft Power BI for reporting and business intelligence
- Google Analytics for tracking website and campaign performance
These tools are designed for different skill levels. Some require technical expertise, while others are built for non-technical users.
Data Integration Tools
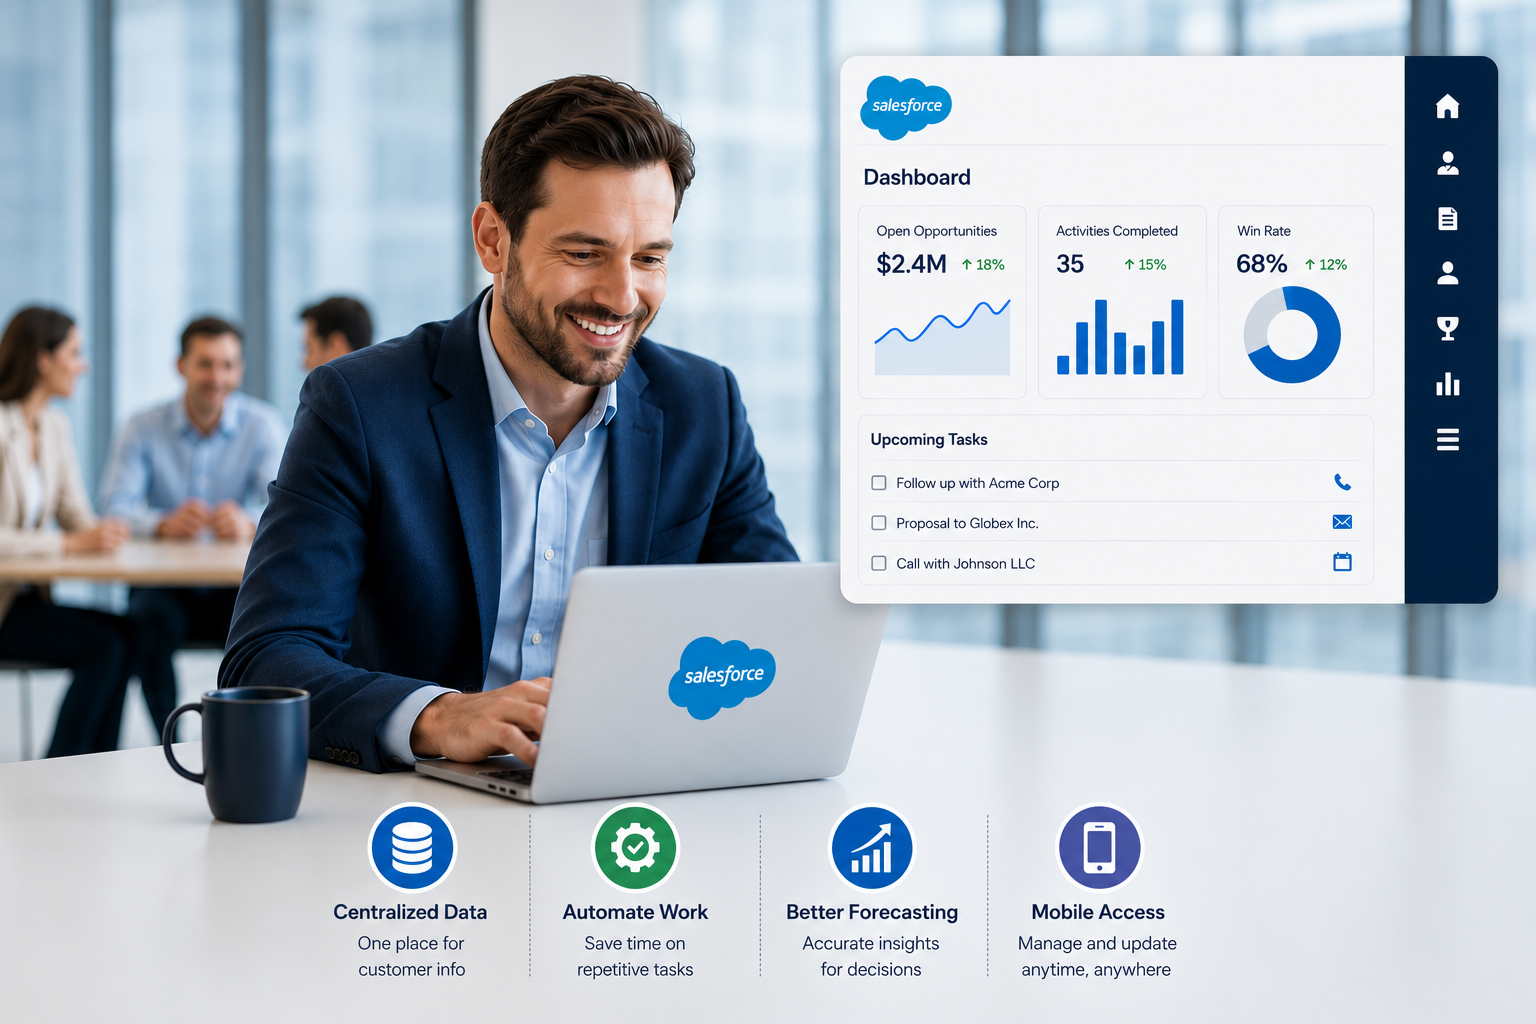
Data rarely lives in one place. Businesses use CRMs, marketing platforms, finance tools, and internal systems. Integration tools connect these systems so data flows smoothly between them.
Examples include:
- Apache Kafka for real-time data streaming
- Talend for ETL processes
- Informatica for large-scale enterprise integration
Without integration tools, analytics platforms rely on incomplete or outdated data.
Why Businesses Need Both
Analytics tools without integration create fragmented insights. Integration tools without analytics only move data without generating value. When both work together, businesses get a complete and accurate picture.
For example, marketing data combined with sales data can reveal actual ROI instead of just traffic numbers. This kind of connection is what drives better decisions.
Key Factors to Consider Before Choosing Tools
Business Goals and Use Cases
Start with clarity on what you want to achieve. Some businesses need simple dashboards, while others require predictive analytics or real-time monitoring.
- Reporting and dashboards
- Customer behavior analysis
- Forecasting and predictive insights
- Operational tracking
A mismatch between tools and goals leads to underuse or unnecessary complexity.
Data Sources and Complexity
Every business collects data differently. Some rely on structured databases, while others deal with unstructured data like logs, emails, or social media.
Consider:
- Number of data sources
- Type of data (structured vs unstructured)
- Frequency of updates
- Data volume
Integration becomes more complex as these factors increase.
Scalability and Performance
Data grows quickly. Tools that work well today may struggle within a year if they cannot scale.
According to IDC, global data creation is expected to reach 175 zettabytes. That scale requires tools that can handle increasing loads without performance issues.
Ease of Use and Learning Curve
Not every team has data engineers. Tools should match your team’s skill level.
- Self-service dashboards for non-technical users
- Advanced customization for technical teams
- Clean interface and documentation
Adoption often depends more on usability than features.
Integration Capabilities
Check how well a tool connects with your existing systems.
- Built-in connectors
- API support
- Real-time vs batch processing
- Compatibility with cloud platforms
Poor integration leads to manual work, which defeats the purpose of automation.
Data Security and Compliance
Data security is not optional. Businesses handling sensitive data must follow regulations like GDPR or industry-specific compliance standards.
Look for:
- Role-based access control
- Data encryption
- Audit logs
- Compliance certifications
Cost and ROI
Pricing goes beyond subscription fees. Consider:
- Setup costs
- Maintenance
- Training
- Scaling costs
Cloud-based tools often reduce infrastructure costs but may increase long-term subscription expenses.
Types of Data Analytics Tools
Business Intelligence Tools
These tools are often implemented as part of broader data visualization services to help teams understand performance metrics clearly.
Examples:
- Tableau
- Power BI
They help visualize trends and monitor KPIs.
Big Data Analytics Tools
Designed for handling large datasets, these tools process massive volumes of data efficiently.
Example:
- Apache Spark
They are commonly used in enterprises and tech-driven businesses.
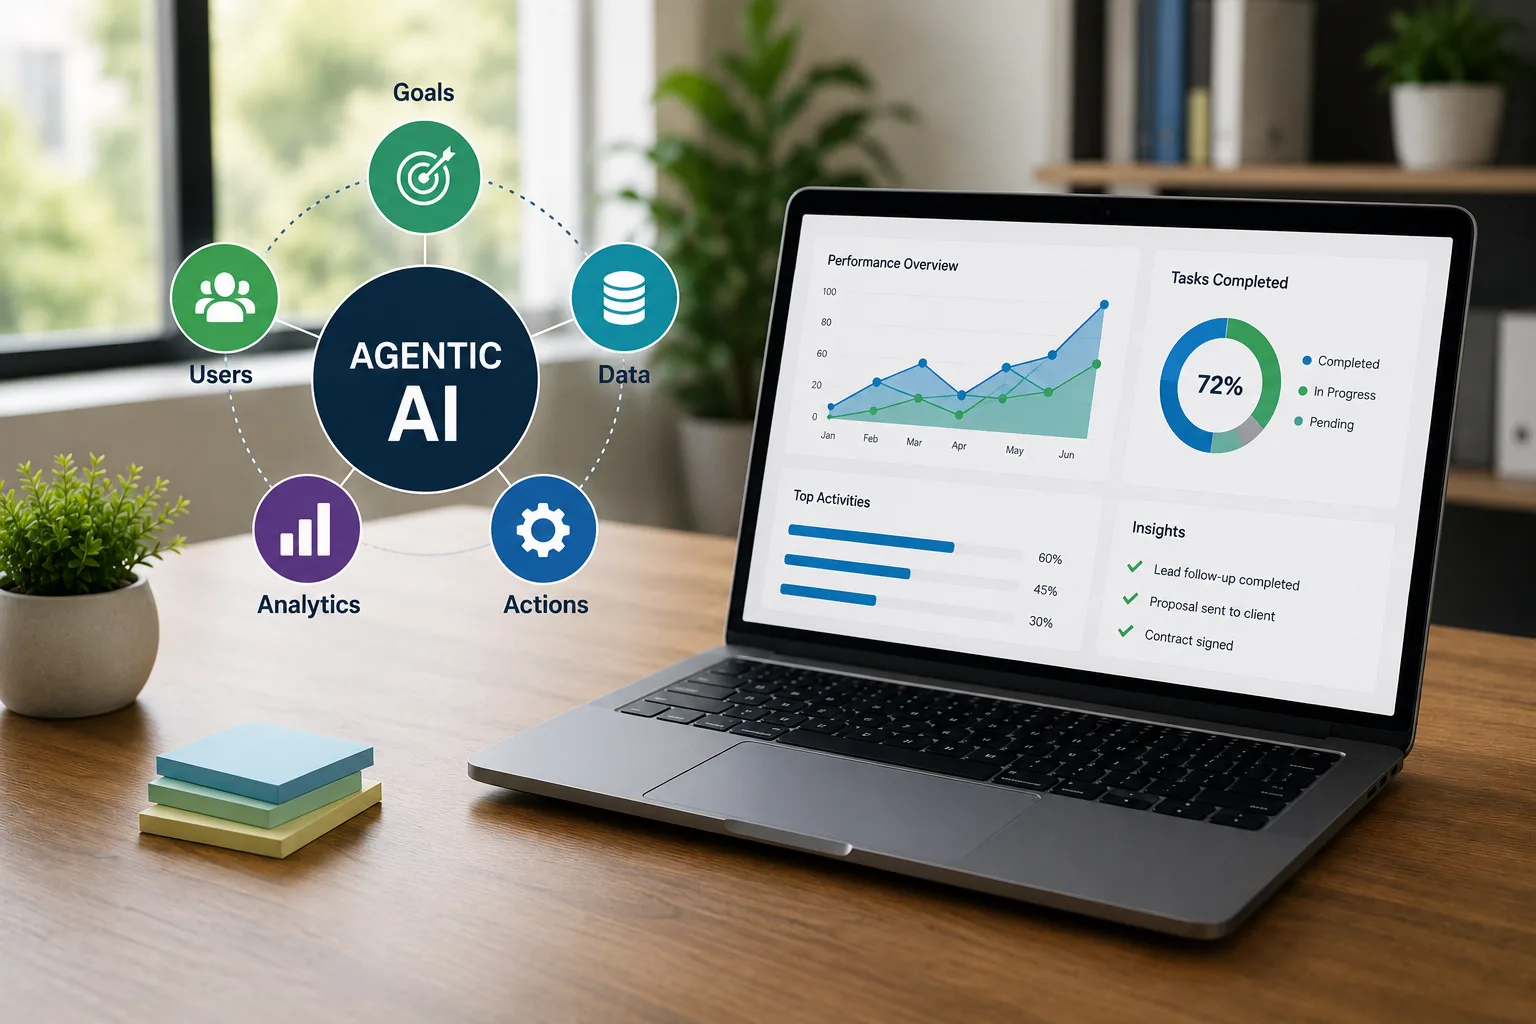
Predictive and AI Analytics Tools
Advanced businesses combine analytics with AI through machine learning solutions to predict trends and automate decision-making.
Example:
- IBM Watson
They are useful for demand forecasting, risk analysis, and personalization.
Marketing Analytics Tools
Focused on customer behavior and campaign performance.
Example:
- Google Analytics
These tools help track conversions, user journeys, and engagement.
Read Also: Why Is Data Visualization Important In High-Data Industries
Types of Data Integration Tools
ETL Tools
Extract, Transform, Load tools process data in batches. They are widely used for traditional data warehousing.
Examples:
- Talend
- Informatica
ELT Tools
These tools load data first and transform it later, usually within cloud environments.
Example:
- Fivetran
They are faster and more flexible for modern data systems.
Real-Time Integration Tools
These tools process data instantly, making them suitable for applications that require live updates.
Example:
- Apache Kafka
API-Based Integration Tools
These tools connect applications using APIs and are often used for automation.
Example:
- Zapier
They are ideal for small to mid-sized businesses.
How to Evaluate Tools: A Practical Framework
Step 1: Define Clear Requirements
List your goals, data sources, and expected outcomes. Without this step, comparisons become meaningless.
Step 2: Shortlist Tools
Filter tools based on:
- Features
- Compatibility
- Budget
Avoid evaluating too many options at once.
Step 3: Compare Features
Focus on what matters:
- Visualization
- Automation
- Real-time capabilities
- Customization
Ignore features you will not use.
Step 4: Test with Real Data
Trials and demos are useful, but real data testing gives a clearer picture. It helps identify performance issues and usability gaps.
Step 5: Check Vendor Support
Reliable support saves time during setup and troubleshooting.
Look for:
- Documentation
- Community forums
- Customer service response time
Common Mistakes to Avoid
- Selecting tools based on trends instead of needs
- Ignoring integration compatibility
- Underestimating data cleaning efforts
- Paying for features that are never used
- Skipping training for teams
These mistakes often lead to low adoption and wasted investment.
Real-World Examples of Tool Selection
Small Business Scenario
A small business with limited budget may choose:
- Power BI for reporting
- Zapier for automation
This combination provides insights without heavy investment.
Enterprise Scenario
Large organizations often require scalable systems:
- Informatica for integration
- Apache Kafka for real-time data streaming
This setup supports complex and high-volume data environments.
Marketing Team Scenario
Marketing teams usually focus on campaign performance:
- Google Analytics for tracking
- CRM integration for lead management
This helps connect traffic data with actual conversions.
Read Also: Can Small Businesses Benefit From AI and Analytics Techniques?
Trends Shaping Data Analytics & Integration Tools
AI-Driven Analytics
AI is becoming a standard feature in analytics tools. It helps automate insights and reduce manual analysis.
Cloud-Based Platforms
Most modern tools are cloud-first, offering flexibility and scalability without heavy infrastructure.
Real-Time Data Processing
Businesses are shifting from batch processing to real-time insights. This is especially important for eCommerce and SaaS platforms.
Data Accessibility
More companies are enabling non-technical users to access data through simple dashboards.
According to Statista, the global big data market continues to grow rapidly, driven by demand for faster and more accurate insights.
Final Checklist Before Choosing a Tool
- Does the tool align with your business goals?
- Can it handle your current and future data volume?
- Does it integrate with your existing systems?
- Is it easy for your team to use?
- Does it provide value for its cost?
Build a Data System That Actually Supports Business Decisions
Disconnected tools and inconsistent data often lead to slow reporting and unclear insights. A structured analytics approach helps unify your data sources, automate reporting, and deliver real-time visibility across your operations. This makes it easier to track performance, reduce manual work, and make decisions based on accurate data.
Explore Our Data Analytics Services
Conclusion
The effectiveness of any data strategy depends on how well tools fit into existing workflows. Tools should simplify processes, not complicate them. A careful evaluation based on real needs ensures better adoption, accurate insights, and long-term value.
If you plan to implement or upgrade your data stack, taking a structured approach to selection will help avoid costly mistakes and improve overall performance. You can also position your brand here naturally when publishing the final version to connect the topic with your services.